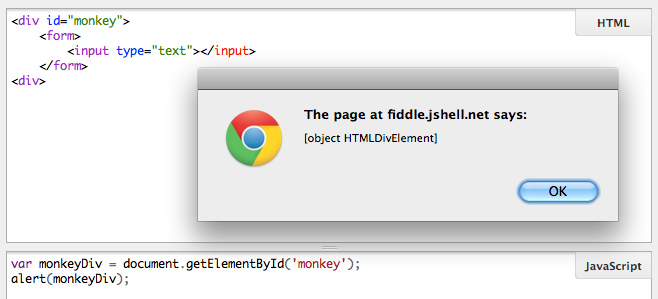
I love JavaScript, and working within the Force.com Platform I’m always finding new ways that it can be applied to business needs. I know this is the case for many developers out there but I’ve seen that their typical development process is:
- Develop the JS code
- Create bug
- Include calls to the alert() method to troubleshoot
- Iterate
alert() is bad for debugging
I’m sure this process sounds familiar to many of you, but do you know what, the alert() method is a very weak way of troubleshooting. I abandoned it years back because of poor features such as outputting object representations as ‘[object]’ or ‘[undefined]’ – which doesn’t give you a lot to go on.
Meet console.log()
Modern browsers have access to a library called ‘console‘ which offers a far richer experience, and without the annoying pop-ups. The console.log() method accepts any JavaScript type as a parameter and will always give you detailed and sensible output. In the images below I’ve passed the method a variable representing a Div and the log outputs the entire DOM from the Div down. You can even pass it jQuery objects and it’ll output all of that object’s associated data!


So where does it output to? On the console tab of course. I almost always use Chrome these days and you’ll find the console tab if you open Chrome’s Developer Tools. It’s similarly placed within Firebug for Firefox.
For those who’d like to learn more about the console library here’s an excellent article. There you’ll see that the library has far more to offer than just the log() method.
Debugging Custom JavaScript Button
A neat tip to remember is that console.log() is available wherever JavaScript is used on the platform. That means you can even debug the JavaScript you use to access the AJAX API through Custom Buttons!
Nice on, it is totally mandatory to drop the alert debugging when doing some serious Javascript.
If you still want to use information displayed on-screen you can always add them to an absolute div on screen.
Thanks a lot! Was just working with some javascript and force.com and was getting annoyed with alert since it means I couldn’t show my users the work in progress without commenting out a bunch of code.
Glad I could help!
Addaboy. Just be careful to take those console logs out before you go live as they will throw errors in IE etc 😉
Thanks champ.
Or you could leave it and check for console.log
if(console) console.log(‘blah’);
Great Post Wes !!
Its a common bad habit in JS developers not to use console.log or the debugging capabilities in browsers(chrome/ff, I hate IE’s debugger).
console.log is even safe to leave in code, you don’t need to remove it like alerts, after debugging is done.
Agreed except it’ll throw errors in IE if you leave it. My above comment shows how to work around that by checking for console. For IE I like to use firebug lite for debugging. It is a quick way to restore the console back. It isn’t perfect, but works pretty decently.
http://getfirebug.com/firebuglite
Dude, nice post. This is a total must for folks to have in their Javascript Toolkits!
Nice nugget to share! Thanks!
Just to add, when you want to debug AJAX calls, you can use the less known debug call of the toolkit (sforce.debug.trace=true;). This will give you the details of the Ajax request and response.
Excellent point.
Adding to the discussion,
Don’t forget the very useful console.dir() and console.dirxml() functions for debugging html fragments. I found these to be quite useful when debugging “this” when I was adding some jQuery to my VF page.
The value of “this” is a bugger! It seems that it resolves to the root page, like “DomDocument”, when your function is called from an event, even an onchange event handler called from an input! Not what I would have expected.